Here is his previous ECG:
Normal ST Elevation
Queen of Hearts Interpretation:
Resident's interpretation: Reperfusion pattern/Wellens' with biphasic T waves in V2 and V3, and in comparison to an EKG in 2020 this is new.
Course: Aspirin 325mg, chemistry, CBC, troponin panel all ordered. Bedside ultrasound with no apparent wall motion abnormalities, no pericardial effusion, no right heart strain. Aorta briefly viewed, appears normal caliber and diameter.
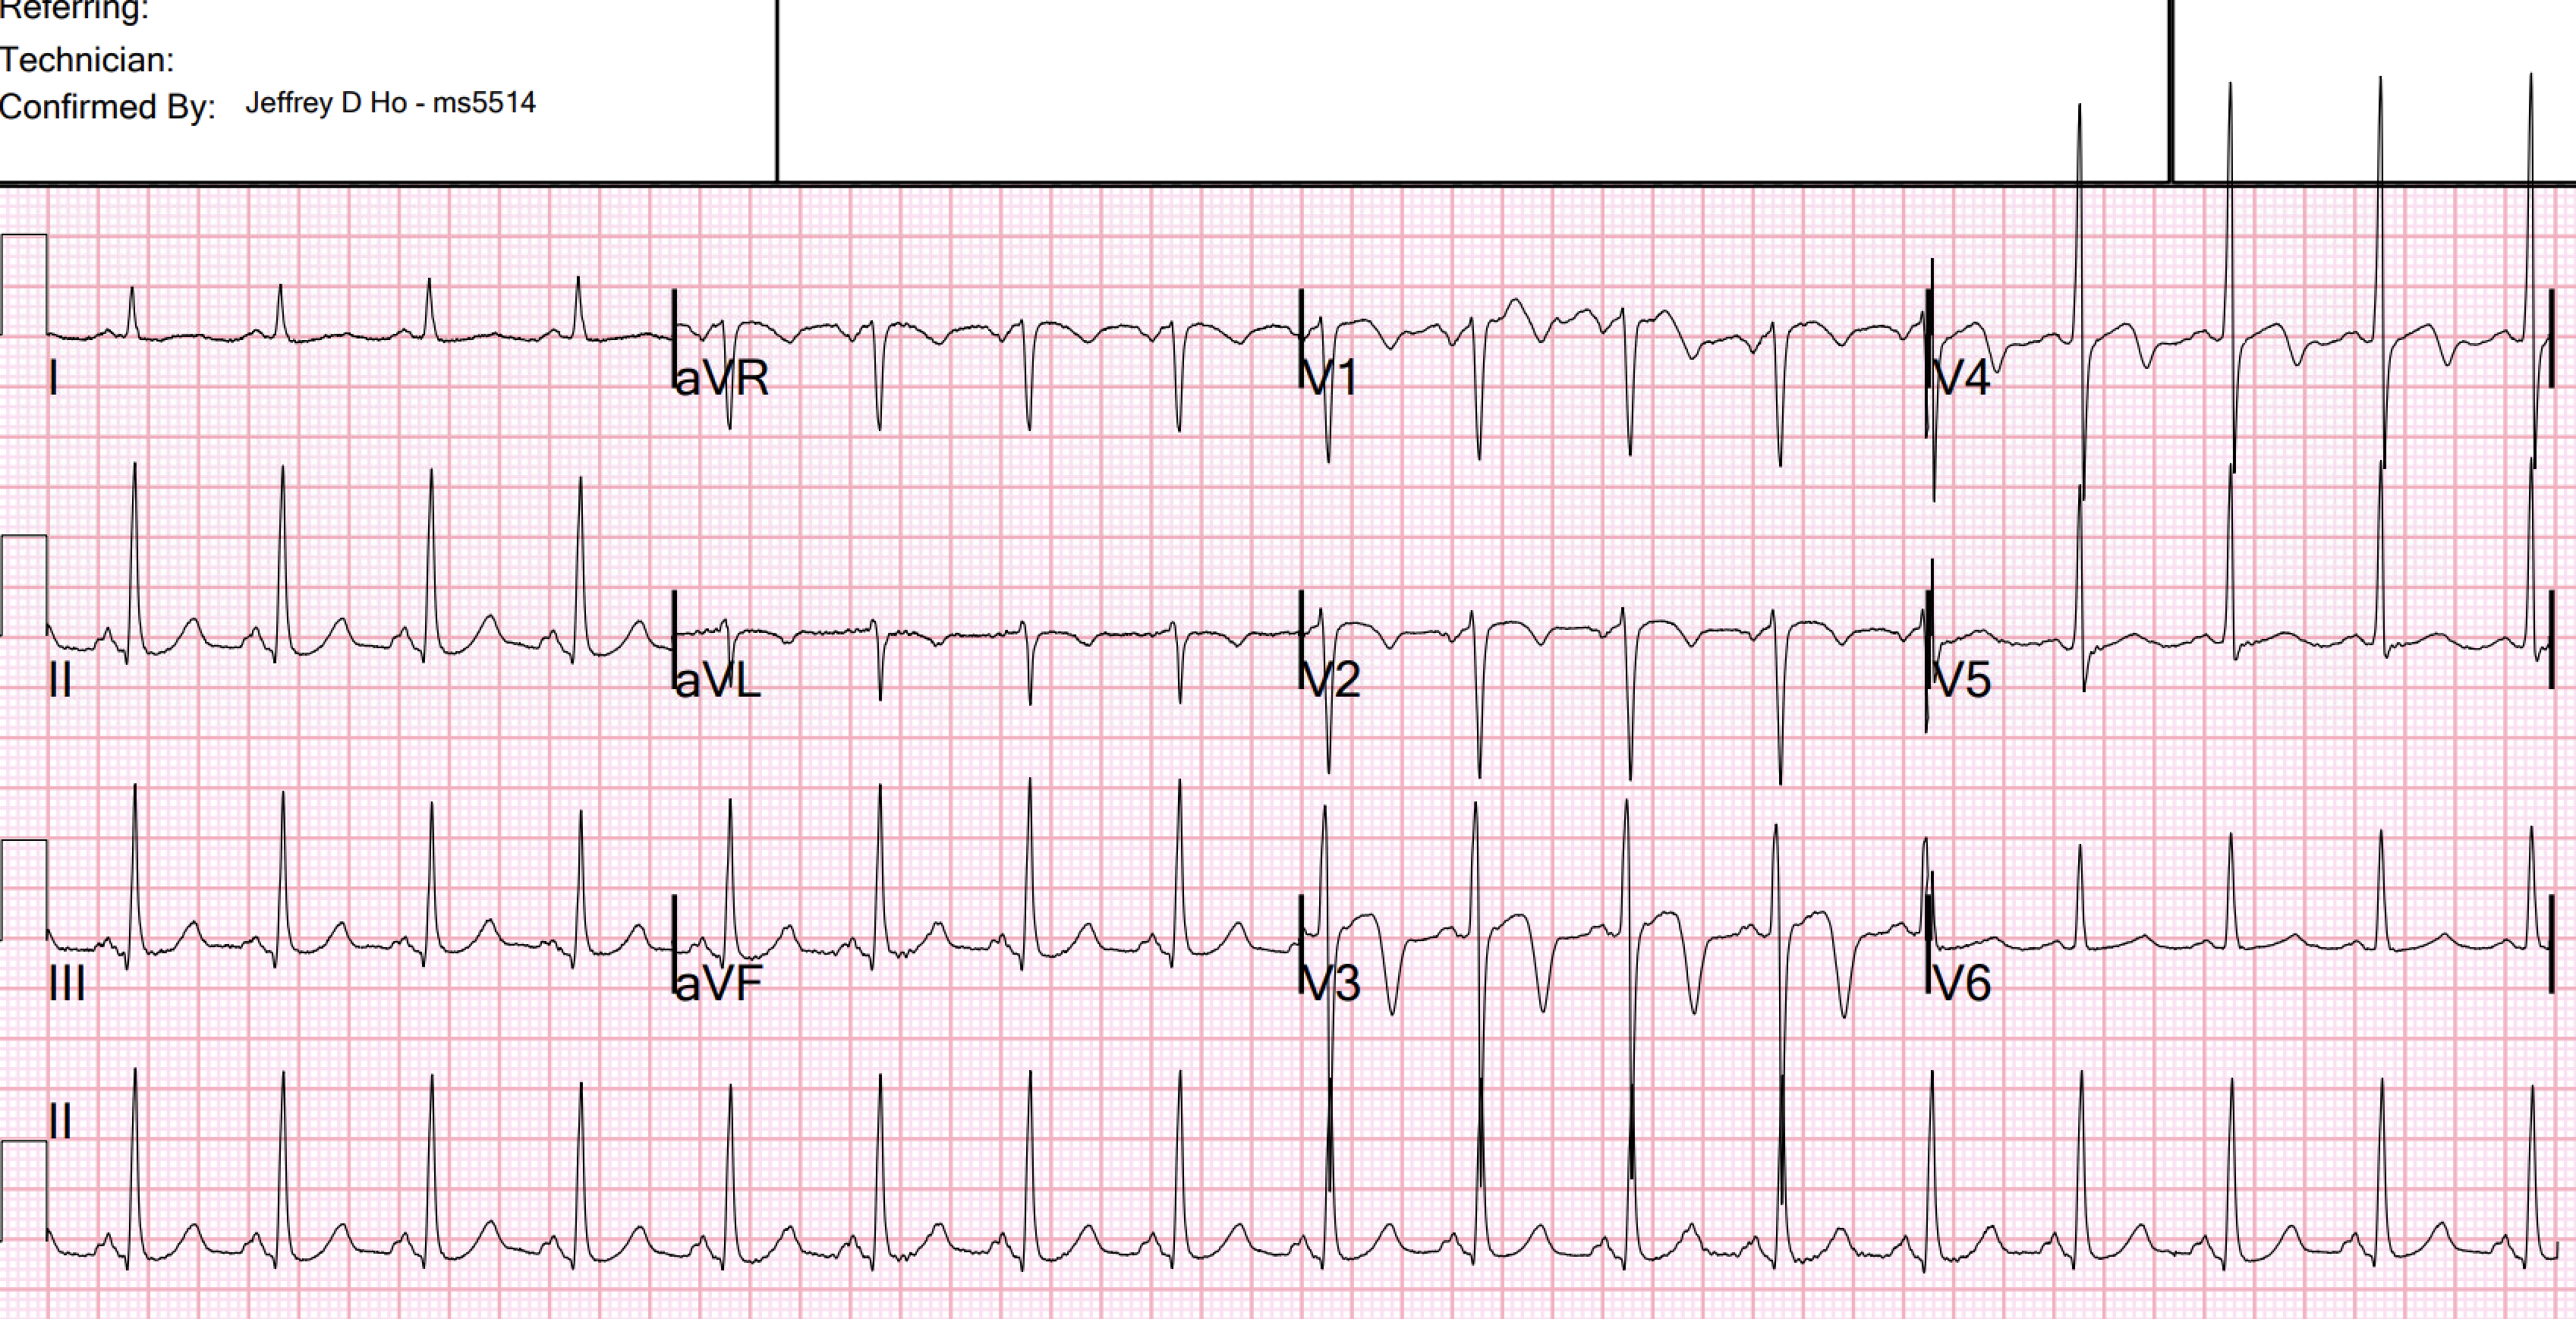
Repeat EKG:
Resident interpretation: ST elevation in V2 significantly different than his previous EKG. Patient still not having chest pain however this is more concerning for OMI/STEMI. He was transferred to the stabilization room for cath lab activation. Labs ordered but not yet drawn. Aspirin given.
Smith: I don't think that there is really any change in ST Elevation. This change is due to a change in lead placement: in the first ECG (top), leads V1 and V2 were placed too high (P-wave inverted). This leads to recording less ST elevation in lead V2. In the later, 2nd, ECG, the leads are correctly placed and the ST Elevation appears to be greater.
This is a stable ECG. Patient is pain free and clearly has Wellens' syndrome: 1) pain free episode following an episode of angina, typical Pattern A (biphasic, terminal T-wave inversion with an initial upsloping ST Segment) findings, preserved R-waves. Pattern B is has deep symmetric T-wave inversion without the initial upwardly sloping ST Elevation. Pattern A evolves into Pattern B.
This is a great series of ECGs demonstrating the evolution:
_________________________________
Does Wellens' syndrome require emergent cath lab activation?? Or is antiplatelent and antithrombotic therapy adequate to prevent re-occlusion before delayed intervention?
Wellens' syndrome is a syndrome of Transient OMI (old terminology would be transient STEMI).
This is a demonstration of how Wellens' is transient OMI:
There are more examples here: https://hqmeded-ecg.blogspot.com/search?q=wellens+prehospital
And this is literature from Wellens' himself showing how Wellens waves occur after reperfusion with thrombolytics. (first authors are Wehrens and Doevendans, respectively)
Wehrens XH, Doevendans PA, Ophuis TJ, Wellens HJ. A comparison of electrocardiographic changes during reperfusion of acute myocardial infarction by thrombolysis or percutaneous transluminal coronary angioplasty. Am Heart J. 2000;139:430–436.
Doevendans PA, Gorgels AP, van der Zee R, Partouns J, Bar FW, Wellens HJJ. Electrocardiographic diagnosis of reperfusion during thrombolytic therapy in acute myocardial infarction. Am J Cardiol. 1995;75:1206–1210.
As far as I can tell, there is only one randomized trial of immediate vs. delayed intervention for transient STEMI.
(There is no randomized trial, or even observational trial, of immediate vs. delayed intervention for Wellens' syndrome.)
Lemkes JS, et al. Timing of revascularization in patients with transient ST-segment elevation myocardial infarction: a randomized clinical trial. Eur Heart J [Internet]. 2019;40:283–291. Available from: http://dx.doi.org/10.1093/eurheartj/ehy651.
In this study, the major outcomes were the same for both groups, but of 70 patients in the delayed group, 4 required emergent intervention for sudden re-occlusion. You can make your own conclusions.
I think I would want to intervene before there is risk of re-occlusion.
However, one could make a reasonable argument for delaying, especially if you would need to awaken your cath team in the middle of the night. It requires full antiplatelent and antithrombotic therapy, and, in my opinion, if you delay, you should institute continuous 12-lead ECG monitoring.
This is why:
1. Why we need continuous 12-lead ST segment monitoring in Wellens' syndrome
____________________
Case Continued
The Cath lab was activated 70 minutes after ED arrival.
First hs troponin I returned 108 minutes after ED arrival and was normal: (12 ng/L)
___________________
No "upstream" P2Y12 were given in the ED ("upstream" means "before the angiogram "defines" the coronary anatomy). Upstream P2Y12 is often given, but my reading of the literature is that the benefit is limited, especially since intravenous Cangrelor can be given at the time of angiography, after the coronary anatomy is defined. This way, if there is need for CABG, surgery need not be delayed due to risk of bleeding from persistent P2Y12 inhibition.
Paper on upstream P2Y12: https://www.nejm.org/doi/full/10.1056/nejmoa1407024
Thus, in this case, no ticagrelor was given.
Angiography:
--Culprit for the patient's unstable angina/Wellen syndrome is a ruptured plaque in the mid LAD.
--As suggested by the EKG, there is TIMI-3 flow on initial angiography
--LAD is a large-caliber vessel that extends to the apex
--There is an 80 to 90% stenosis in the mid LAD with TIMI-3 flow beyond on initial angiography
--This lesion has angiographic characteristics of plaque rupture and is likely the culprit for the patient's Wellens syndrome/unstable angina
Cangrelor given after coronary anatomy defined
The lesion was stented
Peak troponin was 108 ng/L. Total coronary occlusion, if very brief, may have minimal infarction and yet be very dangerous.
Formal Echo:
Normal left ventricular cavity size, and normal LV systolic function.
Normal estimated left ventricular ejection fraction; 54%.
Regional wall motion abnormality-apical septum and apex, hypokinetic.
Increase in LV wall thickness, asymmetric (see below).
Normal right ventricular size and function.
Thus, even with this very small infarct, there was myocardial stunning (wall motion abnormality in the absence of significant infarct. This is common and the wall will almost always recover some time before about 6 weeks.
Here are other very interesting posts:
Wellens' has mimics and some are extremely difficult, as in this post:
Here are many examples of a very common mimic, which we call "Benign T-wave Inversion" and is a variant of Early Repol:
===================================
MY Comment, by KEN GRAUER, MD (4/22/2024):
===================================
When we talk about Wellens’ Syndrome — It is all about timing. Despite description of Wellens’ Syndrome over 40 years ago — this syndrome remains misunderstood by all-to-many clinicians (See My Comment at the bottom of the page in the August 12, 2022 post in Dr. Smith’s ECG Blog).
Two ECG patterns were described by the original investigators in 1982 as being consistent with a Wellens’ Syndrome prediction of high-grade LAD stenosis.
- Pattern B — was the more common form in the original Wellens’ report. In my experience — this ECG pattern is less specific for high-grade LAD stenosis, because other entities (including non-cardiac CNS conditions) may also be associated with symmetric T wave inversion.
- In contrast, Pattern A — was much less common in the original Wellens’ report. That said, when the history is “right” for Wellens’ Syndrome — the steep T wave descent from the T wave peak that Pattern A features is more specific for Wellens’ Syndrome in my experience, than the symmetric T wave inversion of Pattern B.
- In the initial ECG from today’s case — the ST-T wave appearance within the light BLUE rectangles in Figure-1 is consistent with the more specific ECG Pattern A. This is especially true for the ST-T wave in lead V3 — in which descent of the T wave from the peak of the coved and slightly elevated ST segment, is extremely steep ( = another example of an ECG condition in which a picture is “worth 1,000 words” — because the shape of this steep T wave descent is unique).
Misunderstood Features of Wellens:
- For Wellens’ Syndrome to be present — the Hx must be of prior CP (Chest Pain) that has now resolved at the time the ECG is recorded. If CP is still present — then this is not Wellens’ Syndrome. Instead, persistent CP may indicate ongoing infarction and/or reperfusion T waves that develop after a completed event.
- It is the pathophysiology of a true "Wellens' Syndrome" that is commonly misunderstood — in that there has been transient coronary occlusion — that then spontaneously resolves, with resultant resolution of CP (and no more than minimal myocardial damage).
- The above pathophysiology is the reason Dr. Smith's recognition that the repeat ECG in today's case was not evolving is important. This is because by the above rationale — recognition of Wellens' Syndrome implies a temporarily "stable" situation after there has been spontaneous reperfusion of the "culprit" LAD lesion.
- As per Dr. Smith’s above review of current literature on this issue — it would seem that prompt cath with PCI of a patient with Wellens' Syndrome is preferable to close monitoring while you wait and hope that you don't have to do emergency cath IF the "culprit vessel" reoccludes. And, given that such reocclusion of the "culprit" vessel might occur at almost any time after spontaneous reperfusion (ie, hours or even days later) — What IF the spontaneous reocclusion only occurs after the patient has been sent home because "nothing happened" during the 1-2 days that the patient was monitored in the hospital?
-USE.png) |
| Figure-1: I've labeled the initial ECG in today's case. |
Additional Take-Home Points:
I thought the KEY clinical point underscored by Dr. Smith's insightful presentation of today's case is how quickly the diagnosis of Wellens' Syndrome can be made.
- Clearly — comparison of ECG #1 with the previous ECG on today's patient confirmed that the steep T wave downsloping, in association with anterior T wave inversion was a new finding. BUT — prior tracings are not always available — and even IF this prior ECG would not have been found — the diagnosis of Wellens' Syndrome was already confirmed by brief history that the patient's CP had resolved at the time the uniquely steep anterior T wave downsloping was seen on the initial ECG.
- Sobering Note: The need for prompt cath in today's case was only appreciated after the 2nd ECG was done — in which a change in lead placement led to the team mistakenly concluding that there was increased ST elevation. (See My Comment in the April 17, 2022 post of Dr. Smith's ECG Blog for review on how to recognize too-high placement of the V1,V2 electrodes).
Final Thoughts:
- The diagnosis of Wellens' Syndrome in today's case was made more difficult because this 50-something man with hypertension has LVH on ECG (by Peguero Criteria — as sum of the 25 mm S in V3 + the 13 mm S in V4 >28 mm — as per LVH Criteria that I detail in my Figure-3 of the April 17, 2022 post).
- That said — LV "strain" should never look like the steep T wave descent that we see in lead V3 of Figure-1, in which there is no indication of LV "strain" in the lateral chest leads.
- BOTTOM Line: The history in today's case of new CP that had resolved by the time the initial ECG showing the unique steep T wave downsloping with anterior T wave inversion was done — should allow immediate recognition of Wellens' Syndrome. From what we know about the pathophysiology of Wellens' Syndrome — it would seem that the sooner prompt cath with PCI can be arranged, the better the chance for optimal outcome.


-USE.png)


-USE.png)